
Showing posts with label jobless recovery. Show all posts
Showing posts with label jobless recovery. Show all posts
Monday, April 9, 2012


Monday, January 31, 2011

Friday, December 3, 2010
November Unemployment 9.8%
 This graph shows the job losses from the start of the employment recession, in percentage terms - this time from the start of the recession. In the previous post, the graph showed the job losses aligned at the bottom.The dotted line shows payroll employment excluding temporary Census workers. This is by far the worst post WWII employment recession.
 The second graph shows the job losses from the start of the employment recession, in percentage terms aligned at maximum job losses.The dotted line is ex-Census hiring. The two lines have joined since the decennial Census is over.For the current employment recession, employment peaked in December 2007, and this recession is by far the worst recession since WWII in percentage terms, and 2nd worst in terms of the unemployment rate (only the early '80s recession with a peak of 10.8 percent was worse).
 The unemployment rate increased to 9.8% (red line).The Employment-Population ratio declined to 58.2% in November matching the cycle low set in 2009 (black line). The Labor Force Participation Rate was steady at 64.5% in November (blue line). This is the percentage of the working age population in the labor force. The participation rate is well below the 66% to 67% rate that was normal over the last 20 years.
Tuesday, October 12, 2010

Saturday, August 7, 2010
July 2010:

For the current employment recession, employment peaked in December 2007, and this recession is by far the worst recession since WWII in percentage terms, and 2nd worst in terms of the unemployment rate (only early '80s recession with a peak of 10.8 percent was worse).
source
Friday, August 6, 2010
July 2010 Unemployment Graphs
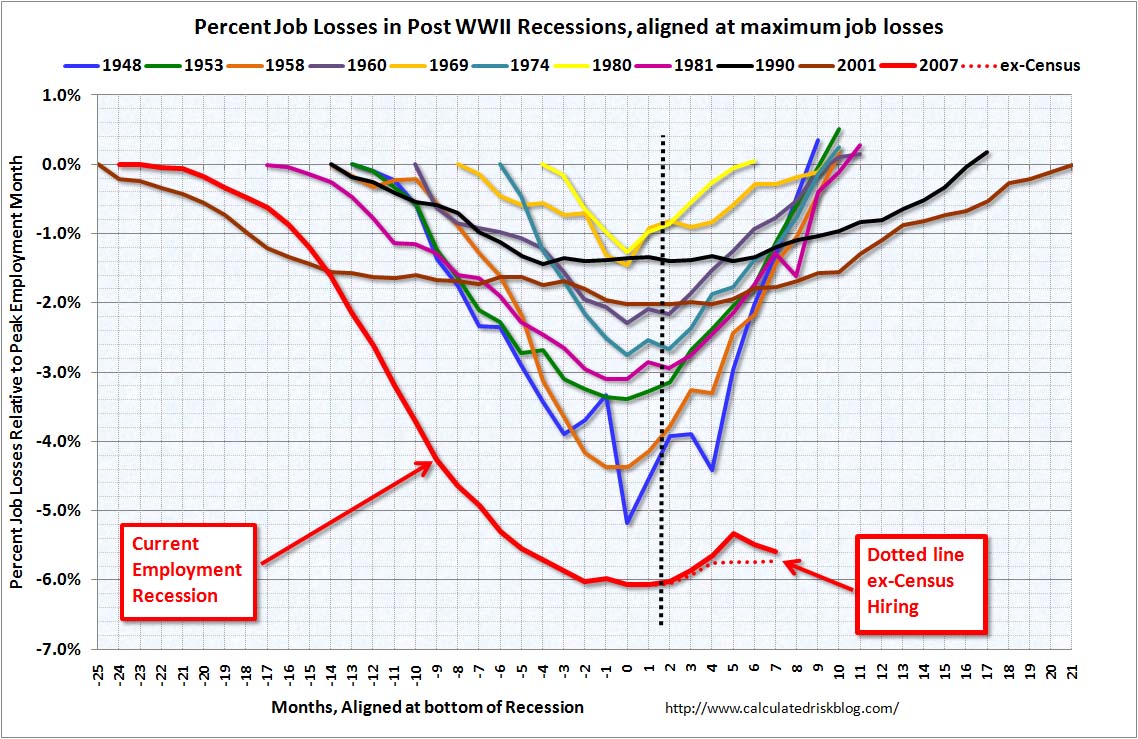


Longer. Deeper. And flat at the bottom. Unfortunately that describes the 2007 employment recession...
The Employment-Population ratio decreased to 58.4% in July from 58.5% in June...
The Labor Force Participation Rate decreased to 64.6% from 64.7% in June...
The reason the unemployment rate was steady at 9.5% was because people left the workforce - and that is not good news. As the employment picture improves, people will return to the labor force, and that will put upward pressure on the unemployment rate...
According to the BLS, there are 6.572 million workers who have been unemployed for more than 26 weeks and still want a job. This is 4.3% of the civilian workforce, just below the record set last month.
source
Sunday, December 6, 2009

Thursday, October 22, 2009
 source
Monday, October 5, 2009
 source
Wednesday, August 12, 2009

Subscribe to:
Posts (Atom)