Showing posts with label budget deficit. Show all posts

Tuesday, October 18, 2011

2011 Budget Deficit: $1.298 Trillion


The Congressional Budget Office recently finished tallying the revenue and spending figures for fiscal 2011, which ended September 30, and no wonder no one in Washington is crowing. The political class might have its political pretense blown. This is said to be a new age of fiscal austerity, yet the government had its best year ever, spending a cool $3.6 trillion. That beat the $3.52 trillion posted in 2009, when the feds famously began their attempt to spend America back to prosperity.


What happened to all of those horrifying spending cuts? Good question. CBO says that overall outlays rose 4.2% from 2010 (1.8% adjusted for timing shifts), when spending fell slightly from 2009. Defense spending rose only 1.2% on a calendar-adjusted basis, and Medicaid only 0.9%, but Medicare spending rose 3.9% and interest payments by 16.7%.


The bigger point: Government austerity is a myth.


Wednesday, July 6, 2011

Stimulus Spending Equals More Debt, Not Economic Growth


Yet this was the recovery that was aided by the largest Keynesian-style big government “stimulus” since World War II. Since 2008, total federal “stimulus” has been $4.6 trillion, as shown in the chart. As a share of GDP, recent deficit spending has been far greater than during all other recessions since the war.


Biggest Keynesian Stimulus + Slowest Recovery = Time to Rethink Keynesian Theory.


Tuesday, May 31, 2011

Wednesday, April 13, 2011

Budget Antics


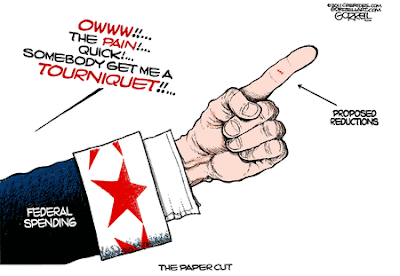
It’s a cut of $38 billion in a budget of $3,819 billion. That’s 1 percent. That’s a rounding error in federal budgeting.


That same budget table shows that federal spending fell from $92.7 billion in 1945 to $55.2 billion in 1946, to $34.5 billion in 1947, and to $29.8 billion in 1948.


The fundamental point here is that federal spending rose by more than a trillion dollars during Bush’s first seven years, and then by almost another trillion in barely three fiscal years. And then we had a titanic battle over whether to trim $38 billion.


FY 2001 $1,863

FY 2008 $2,983

FY 2011 $3,819


Wednesday, February 9, 2011

Budget Deficits: A Spending Problem


The new Congressional Budget Office (CBO) 10-year budget baseline shows a virtually unprecedented sea of red ink. The report reveals an unprecedented $1.5 trillion deficit in fiscal year (FY) 2011—an increase of $95 billion over their last 2011 estimate.[1] This will be the third consecutive year of trillion-dollar deficits.

Monday, August 2, 2010

Bush Tax Cuts and the Federal Deficit

Although the cuts were large and drove revenue down sharply, they are not the main cause of the sizable deficit that exists today. In 2007, well after the tax cuts took effect, the budget deficit stood at 1.2 percent of GDP. By 2009, it had increased to 9.9 percent of the economy. The Bush tax cuts didn't change between 2007 and 2009, so clearly something else is to blame.

The main culprit was the recession -- and the responses it inspired. As the economy shrank, tax revenue plummeted. The cost of the bank bailouts and stimulus packages further added to the deficit. In fact, an analysis by the Center on Budget and Policy Priorities indicates that the Bush tax cuts account for only about 25 percent of the deficit this year.

source

Wednesday, June 23, 2010

Federal Budget: Spending is the Problem


  • Rising spending—not low revenues—is driving the long-term budget deficits. By 2020, spending is projected to be 6.2 percent of GDP above the historical average, while projected 2020 revenues are 0.2 percent of GDP above the historical average. Thus, the entire expanded budget deficit will be caused by rising spending, rather than by falling revenues—even if the 2001 and 2003 tax cuts are extended.
  • Between 2008 and 2020, the cost of Social Security, Medicare, Medicaid, and net interest is projected to rise from 10.2 percent of GDP to 15.6 percent of GDP—making them responsible for nearly the entire rising budget deficit.
source

Federal Budget: Record Deficits and Debt


  • From 1989 through 2008, annual budget deficits averaged $210 billion (adjusted for inflation).
  • President Bush handed President Obama a $1.2 trillion deficit for 2009. Obama added more than $200 billion to it.
  • President Bush’s budget deficits averaged $447 billion. President Obama’s budget shows average deficits of $851 billion over the eight years he would serve if he wins a second term.
  • President Obama’s budget would double the publicly held national debt by 2020.


  • Despite increased borrowing, record-low interest rates have kept net interest costs down.
  • Under the President’s budget, the combination of rising interest rates and a doubling of the national debt would nearly quadruple inflation-adjusted net interest costs over the next decade.
  • By 2020, net interest costs would account for a record 16.1 percent of the federal budget and 4.1 percent of GDP. Net interests costs would be nearly three-quarters the size of the entire $1,041 billion deficit.
source

Thursday, March 18, 2010

National Debt: Bush v. Obama

The latest posting from the Treasury Department shows the National Debt has increased over $2 trillion since President Obama took office.

The debt now stands at $12.6 trillion. On the day Mr. Obama took office it was $10.6 trillion.

President George W. Bush still holds the record for the most debt run up on his watch: $4.9 trillion.

But it took him over four years to rack up the first two trillion dollars in debt.

It has taken Mr. Obama 421 days.

source

Saturday, March 6, 2010

Deficit Projections


Greg Mankiw writes:
Making matters worse, these bleak budget projections are based on relatively optimistic economic assumptions. The administration forecasts economic growth of 3.0 percent from the fourth quarter of 2009 to the fourth quarter of 2010, followed by 4.3 percent the next year. By contrast, the Congressional Budget Office predicts growth of 2.1 percent and 2.4 percent for these two years. Lower growth would mean less tax revenue, larger budget deficits and a more rapidly increasing debt-to-G.D.P. ratio.

source

If the President’s proposals were enacted, the federal government would record deficits of $1.5 trillion in 2010 and $1.3 trillion in 2011. Those deficits would amount to 10.3 percent and 8.9 percent of gross domestic product (GDP), respectively. By comparison, the deficit in 2009 totaled 9.9 percent of GDP.

Measured relative to the size of the economy, the deficit under the President’s proposals would fall to about 4 percent of GDP by 2014 but would rise steadily thereafter. Compared with CBO’s baseline projections, deficits under the proposals would be about 2 percentage points of GDP higher in fiscal years 2011 and 2012, 1.3 percentage points greater in 2013, and above baseline levels by growing amounts thereafter. By 2020, the deficit would reach 5.6 percent of GDP, compared with 3.0 percent under CBO’s baseline projections.

CBO Estimates

2009: 1.413 trillion

2010 CBO baseline: $1360 billion
2010 CBO (Obama): $1500 billion

2011 CBO baseline: $995 billion
2011 CBO (Obama): $1341 billion

2012 CBO baseline: $641 billion
2012 CBO (Obama): $915 billion