 source
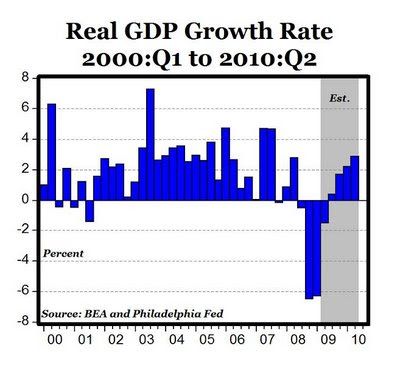
My thoughts: Extremely optimistic.
Economics, as a branch of the more general theory of human action, deals with all human action, i.e., with mans purposive aiming at the attainment of ends chosen, whatever these ends may be.--Ludwig von Mises
 from Carpe Diem
 "For 2004, the CBO found that the top 1 percent of all taxpayers paid 37 percent of all individual income taxes...the next highest 4 percent of the population bore another 16 percent of the tax burden. In contrast, the lowest quintile (the 20 percent of households with the lowest incomes) bore less than 1 percent of the tax burden, and the next quintile bore less than 5 percent."