Economics, as a branch of the more general theory of human action, deals with all human action, i.e., with mans purposive aiming at the attainment of ends chosen, whatever these ends may be.--Ludwig von Mises
Monday, February 27, 2012
Housing Market

Friday, February 10, 2012
Friday, January 13, 2012
Ben Bernanke and Housing Prices
Tuesday, August 23, 2011
Home Sales

Distressing Gap: The following graph shows existing home sales (left axis) and new home sales (right axis) through July. This graph starts in 1994, but the relationship has been fairly steady back to the '60s.
Then along came the housing bubble and bust, and the "distressing gap" appeared due mostly to distressed sales. The flood of distressed sales has kept existing home sales elevated, and depressed new home sales since builders can't compete with the low prices of all the foreclosed properties.
source
Tuesday, July 19, 2011
New Construction

The Commerce Department reported(.pdf) that U.S. housing starts jumped 14.6 percent to an annual rate of 629,000 and that permits for new construction rose 2.5 percent to a 624,000 rate. As noted here many times over the last couple years, despite what you’ll read today, this really isn’t a big deal since the housing market is extremely depressed, homebuilder stocks now the equivalent of 2002-era dot.com stocks for reasons made clear below.
source
Monday, July 4, 2011
Cartoon: Housing Market
Thursday, June 2, 2011
Housing Double Dip?
Monday, May 30, 2011
Tuesday, May 10, 2011
Wednesday, April 13, 2011
Wednesday, March 30, 2011
Housing Double Dip?
 Home prices fell in 13 of 20 cities in January, paced by a 3.4 percent decline in Minneapolis, a 2.4 percent drop in Seattle, and a decline of 1.9 percent in San Francisco. On a year-over-year basis, Phoenix saw the biggest drop, down 9.1 percent, followed by a decline of 8.1 percent in Detroit, and prices fell 7.8 percent in Portland. source
 Wednesday, March 23, 2011
Thursday, March 3, 2011
Housing Double Dip?
Sunday, September 26, 2010
Wednesday, September 22, 2010
Saturday, September 11, 2010
Housing and Economic Recovery
Our study of all the postwar recessions and the Great Depression leads to the following empirical proposition: If there is no recovery in housing expenditures, confirmed by a recovery in consumer durable goods expenditures, then there is no economic recovery.
In the Great Depression and in every recession since, recovery of residential construction has preceded recovery in every other sector, and its recovery has been far larger in percentage terms than the recovery in any other major sector.
Applied to the Great Recession, it appears that those who see signs of a recovery may be grasping at straws. What one should hope is that this time it is different from every one of the past 14 U.S. downturns, but those who believe this have the weight of past experience against them.
We looked at all the major expenditure components of Gross Domestic Product in percentage deviations from their levels in the fourth quarter of 2007, officially declared as the start of the Great Recession by the National Bureau of Economic Research.
The onset of and decline during this recession were like previous recessions, though its course has been deeper and longer. By quarter four of 2007, sales of new homes had fallen without interruption for nine straight quarters and expenditures on new residential construction had fallen for seven quarters—strong lead time signals of the looming distress. New home sales recovered briefly in 2009 but have now declined for three quarters. Residential construction expenditures have essentially been flat for five quarters. Consumer durables spending at best has stabilized, up slightly from its low in the fourth quarter of 2008.
The average increase in new residential construction in the first year following the previous 10 postwar recessions has been 26.3%. The largest increase in residential construction followed the 1981-82 recession, when it increased 75.5% as monetary policy was relaxed. In the past year, residential construction has increased 6.3%. This is the slowest rebound in residential construction in any sustained recovery from a postwar recession.
No currently debated policy will likely change this situation, as the market is saturated with foreclosed houses and homeowners suffer from $771 billion in negative equity. This fact needs to be confronted: We are almost surely in for a long slog.
Thursday, September 2, 2010
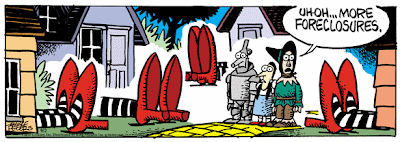
Cartoon: Foreclosures
Thursday, August 26, 2010
Delinquency and Foreclosures

The MBA reports that 14.42 percent of mortgage loans were either one payment delinquent or in the foreclosure process in Q2 2010 (seasonally adjusted). This is down slightly from the record 14.69 percent in Q1 2010.
source
Wednesday, August 25, 2010
Housing Market: The Distressing Gap


Initially the gap was caused by the flood of distressed sales. This kept existing home sales elevated, and depressed new home sales since builders couldn't compete with the low prices of all the foreclosed properties.
The two spikes in existing home sales were due primarily to the first time homebuyer tax credit (the initial credit last year, followed by the extension to April 30th / close by June 30th). There were also two smaller bumps for new home sales related to the tax credit.
Since new home sales are reported when contracts are signed, the 2nd spike for new home sales was in April and then sales collapsed in May. The 2nd spike for existing home sales was in May and June, and then existing home sales collapsed in July.
I expect that eventually this gap will be closed. However that will only happen after the huge overhang of existing inventory (especially distressed inventory) is significantly reduced.
source

 source


